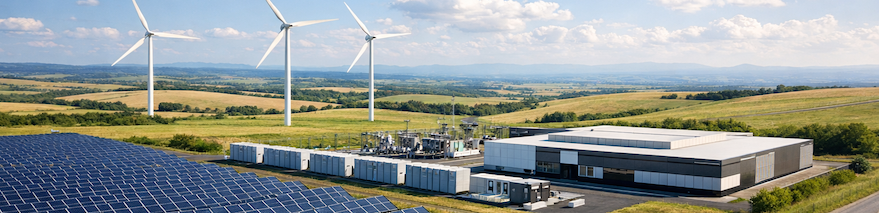
Project Provadia
Renewable Energy Park & AI-Ready Data Center Campus
Project Overview
Provadia renewable energy park spans over 130 hectares of land and is solar and battery storage ready with all premises in place to further develop wind, green hydrogen and co-generation. Minimum estimated energy production is 155.95 GWh/year. Already opened construction site for PV, 33/110 kV step-up substation and battery storage. Existing opportunity to acquire additional 70 ha of adjacent land.
Annual Energy Production
155,95 GWh
Minimum estimated per year
Project Scale
129,65 ha
Land area with expansion potential
Investment Opportunity
€65,7M
Total investment value
Technology Highlights
Solar
1444 kWh/kWp
Wind
7 m/sec
Green H2
Direct injection into gas grid
Battery
BESS with EMS
CCGT
Compressor station adjacent
Financial Highlights
| Return on Investment | Return on Equity | ||
|---|---|---|---|
| Discounting Factor | DF | 0.0659 | 0.1162 |
| Net Present Value | NPV | € 175,933,155 | € 90,127,064 |
| Internal Rate of Return | IRR | 18.07% | 31.83% |
| Return on Capital Employed | ROCE | 7.09% | 11.07% |
| Payback Period | Payback | 7.43 | 4.5 |
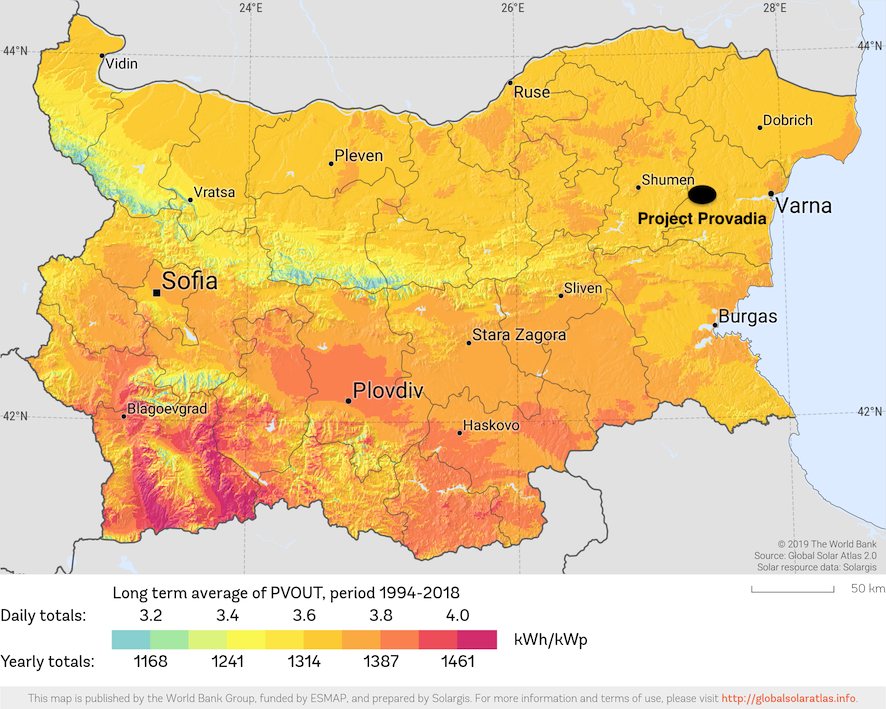
Project Location
Located in Provadia, Bulgaria, the project benefits from excellent solar irradiance levels, making it an ideal location for photovoltaic power generation. The region receives significant solar exposure throughout the year, ensuring optimal energy production.
- •Average solar irradiance: 1444 kWh/kWp
- •Strategic location near major industrial areas
- •Excellent grid connectivity
Strategic Advantages
- ✓Ready-to-build (RTB) project
- ✓JV with a strategic investor (EPC contractor) in place
- ✓Secured corporate Power Purchase Agreements (CPPAs)
- ✓Grid connection to a newly refurbished TSO substation
- ✓PVSYST: 1444 kWh/kWp
- ✓30km from Varna, Bulgaria's third-largest city
- ✓8km from Devnya, Bulgaria's largest industrial zone
- ✓Direct access to A2 (Hemus) highway
Opportunity for 100% off-grid operation, with direct consumption options for green H2 production or an on-site data center (see below).
Additional 70 hectares of adjacent land available for expansion.
Data Center Opportunity
For a hyper-scale tech company or a major colocation provider, a site needs two things: cheap green power and ultra-fast connectivity. Usually these are found in different locations, forcing data centers to pay high grid-transmission fees. Project Provadia offers both in the exact same footprint.
1. Kardesa Connectivity Advantage
The €100M Kardesa project (backed by Vodafone and NEQSOL) is laying a 500 Tbps fiber-optic cable across the Black Sea. To cross Bulgaria it reuses the existing underground pipes owned by Bulgartransgaz — which pass directly through the Provadia plot. A data center built on the expansion land could tap into this 24-core fiber line without digging new cross-country trenches, gaining ultra-low latency, Tier-1 global connectivity at the source, and effectively becoming a major Point of Presence on the new "Digital Silk Road."
2. 24/7 Carbon-Free Energy (CFE)
AI and cloud workloads demand enormous amounts of electricity, and hyperscalers have strict ESG mandates moving from annual RE100 matching toward hourly 24/7 CFE. The co-located generation mix — solar PV, wind, and a utility-scale BESS for firming — enables a behind-the-meter green PPA that matches data center load on an hourly basis. Site readiness for green H2 provides a long-duration storage pathway, while the on-site CCGT co-generation (up to ~300 MWh/h) stands by as a dispatchable 24/7 backup capable of carrying full IT load independently of the public grid.
3. Bidirectional 100 MW Grid Interconnection
The refurbished TSO substation provides a 100 MW grid connection with import/export capability, allowing the site to operate as both an IPP (exporting surplus renewable generation) and a large consumer (drawing backup or complementary supply) under a single point of common coupling. A 400 kV transmission corridor runs ~2 km from the site, offering a future upgrade path to a higher-capacity interconnection should a hyperscale campus justify the capex.
4. Unmatched Speed to Market
Because the Bulgartransgaz pipes are already in the ground and the generation project is Ready-to-Build with all permits and a step-up substation in place, a data center developer bypasses years of bureaucratic red tape and can launch a fully green, hyper-connected facility in a fraction of the standard development time.
The bottom line: with on-site generation, firming, a dispatchable CCGT backup, and a bidirectional 100 MW interconnection adjacent to the Kardesa fiber backbone, Project Provadia is no longer just selling electricity to the grid — it is selling some of the world's most sought-after real estate for next-generation, AI-ready data centers.
Operational Assumptions
| Total Production | |
|---|---|
| AC Total Power | 100,000 kW (100 MW) |
| DC Installed Capacity | 107,800 kWp (108 MWp) |
| Max Production (Annual) | 155,952 MWh |
| PVSYST Efficiency | 1,444 kWh/kWp |
| Negotiated Price (excl. VAT) | €96.00 / 187.76 BGN per MWh |
IBEX Electricity Prices
| Month | Av. price BGN/MWh | Min price BGN/MWh | Max price BGN/MWh |
|---|---|---|---|
| January | 220.57 BGN | 0.02 BGN | 708.62 BGN |
| February | 206.36 BGN | 1.98 BGN | 621.29 BGN |
| March | 168.12 BGN | 0.00 BGN | 424.59 BGN |
| April | 153.39 BGN | -88.01 BGN | 409.94 BGN |
| May | 165.84 BGN | -1.90 BGN | 534.65 BGN |
| June | 178.73 BGN | -19.71 BGN | 825.22 BGN |
| July | 189.19 BGN | -0.08 BGN | 479.77 BGN |
| August | 198.29 BGN | 0.00 BGN | 752.64 BGN |
| September | 198.81 BGN | -1.18 BGN | 782.33 BGN |
| October | 209.10 BGN | -2.15 BGN | 613.33 BGN |
| November | 201.10 BGN | 0.00 BGN | 508.44 BGN |
| December | 159.63 BGN | -0.02 BGN | 452.52 BGN |
Investment Expenses
| Investment Expenses excl. VAT EUR | EUR | EUR per MWp |
|---|---|---|
| Land acquisition | € 16,000,000 | € 148,148 |
| Soft costs | € 2,048,000 | € 18,963 |
| Project & design | € 600,000 | € 5,556 |
| Construction permit fees | € 816,000 | € 7,556 |
| Power Grid access fees | € 0 | € 0 |
| Final TSO contract | € 512,000 | € 4,741 |
| EWRC licensing | € 20,000 | € 185 |
| Other costs | € 100,000 | € 926 |
| Hard Costs | € 47,654,656 | € 441,247 |
| Delivery of: | ||
| Photovoltaic panels | € 10,300,000 | € 95,370 |
| Invertors | € 2,112,800 | € 19,563 |
| Mounting constructions | € 6,528,000 | € 60,444 |
| Others (cables, materials, earthing equipment, etc.) | € 1,094,783 | € 10,137 |
| Management, video & security systems hardware | € 437,913 | € 4,055 |
| Construction & Assembly | ||
| Ground leveling | € 547,392 | € 5,068 |
| Assembling and fixing of constructions & panels | € 682,548 | € 6,320 |
| Construction of fences | € 1,642,175 | € 15,205 |
| Construction of support buildings and facilities | € 218,957 | € 2,027 |
| Construction of roads | € 218,957 | € 2,027 |
| Construction of electricity network | € 1,861,131 | € 17,233 |
| Construction of grid connection facilities | € 7,500,000 | € 69,444 |
| BESS incl. EMS | € 14,000,000 | € 129,630 |
| Other incl. transportation & storage | € 510,000 | € 4,722 |
| Total Soft & Hard Costs | € 49,702,656 | € 460,210 |
| Total Investment | € 65,702,656 | € 608,358 |
Production and Revenue
| Production COD Jan 2026 | Jan | Feb | Mar | Apr | May | Jun | Jul | Aug | Sept | Oct | Nov | Dec | Total |
|---|---|---|---|---|---|---|---|---|---|---|---|---|---|
| Production (MWh) E_Grid | 6,082.1 | 7,797.6 | 12,788.1 | 16,219 | 19,650 | 19,805.9 | 19,338 | 18,246.4 | 14,659.5 | 10,604.7 | 5,926.2 | 4,834.5 | 155,952 |
| Production (as %) | 3.9% | 5.0% | 8.2% | 10.4% | 12.6% | 12.7% | 12.4% | 11.7% | 9.4% | 6.8% | 3.8% | 3.1% | 100.0% |
| MWh sold on IBEX | 6,082.1 | 7,797.6 | 12,788.1 | 16,219 | 19,650 | 19,805.9 | 19,338 | 18,246.4 | 14,659.5 | 10,604.7 | 5,926.2 | 4,834.5 | 155,952 |
| Av monthly IBEX price | €113 | €106 | €86 | €78 | €85 | €91 | €97 | €101 | €102 | €107 | €103 | €82 | €96 |
| Revenue (excl. VAT in thousands) | €687.3 | €826.5 | €1,099.8 | €1,265.1 | €1,670.2 | €1,802.3 | €1,875.8 | €1,842.9 | €1,495.3 | €1,134.7 | €610.4 | €396.4 | €14,706.7 |
Operating Expenses
| Operating Expenses excl. VAT | Amount | as % |
|---|---|---|
| Accounting & Management (p.m.) | € 7,500 | N/A |
| Operating & Maintenance incl. Security (p.m.) | € 20,000 | N/A |
| Insurance (p.a.) | N/A | 0.45% |
| Balancing (per MWh p.m. as per market average) | € 10.225838 | N/A |
| Power Grid Access (per MWh p.m. as per current tariff) | € 2.689395 | N/A |
| Electricity Consumption Costs | N/A | N/A |
| Other (p.m.) | N/A | 2.0% |
| OPEX (in thousands) | Jan | Feb | Mar | Apr | May | Jun | Jul | Aug | Sept | Oct | Nov | Dec | Total |
|---|---|---|---|---|---|---|---|---|---|---|---|---|---|
| Accounting and Management | -€7.5 | -€7.5 | -€7.5 | -€7.5 | -€7.5 | -€7.5 | -€7.5 | -€7.5 | -€7.5 | -€7.5 | -€7.5 | -€7.5 | -€90 |
| Operating and Maintenance | -€20 | -€20 | -€20 | -€20 | -€20 | -€20 | -€20 | -€20 | -€20 | -€20 | -€20 | -€20 | -€240 |
| Insurance | -€18.6 | -€18.6 | -€18.6 | -€18.6 | -€18.6 | -€18.6 | -€18.6 | -€18.6 | -€18.6 | -€18.6 | -€18.6 | -€18.6 | -€223.7 |
| Balancing | -€62.2 | -€79.7 | -€130.8 | -€165.9 | -€200.9 | -€202.5 | -€197.7 | -€186.6 | -€149.9 | -€108.4 | -€60.6 | -€49.4 | -€1,594.7 |
| Power Grid Access | -€16.4 | -€21 | -€34.4 | -€43.6 | -€52.8 | -€53.3 | -€52 | -€49.1 | -€39.4 | -€28.5 | -€15.9 | -€13 | -€419.4 |
| Other (Misc) | -€13.7 | -€16.5 | -€22 | -€25.3 | -€33.4 | -€36 | -€37.5 | -€36.9 | -€29.9 | -€22.7 | -€12.2 | -€7.9 | -€294.1 |
| Total OPEX | -€138.4 | -€163.4 | -€233.3 | -€280.9 | -€333.3 | -€338 | -€333.4 | -€318.7 | -€265.4 | -€205.8 | -€134.9 | -€116.5 | -€2,862 |
| EBITDA | €548.8 | €663.2 | €866.5 | €984.2 | €1,336.9 | €1,464.4 | €1,542.4 | €1,524.2 | €1,229.9 | €928.9 | €475.5 | €279.9 | €11,844.8 |
| % Margin | 79.9% | 80.2% | 78.8% | 77.8% | 80% | 81.2% | 82.2% | 82.7% | 82.3% | 81.9% | 77.9% | 70.6% | 79.6% |
Profit & Loss
| Year | 2024 | 2025 | 2026 | 2027 | 2028 | 2029 | 2030 | 2031 | 2032 | 2033 | 2034 | 2035 | 2036 | 2037 | 2038 | 2039 |
|---|---|---|---|---|---|---|---|---|---|---|---|---|---|---|---|---|
| Stage | Base Year | Y0 | Y1 | Y2 | Y3 | Y4 | Y5 | Y6 | Y7 | Y8 | Y9 | Y10 | Y11 | Y12 | Y13 | Y14 |
| REVENUE | €0 | €0 | €15,420,534 | €15,771,968 | €16,209,719 | €16,659,619 | €17,204,722 | €17,767,661 | €18,349,019 | €18,949,398 | €19,569,423 | €20,209,734 | €20,870,997 | €21,553,896 | €22,259,139 | €22,987,458 |
| Produced/Sold MWh | 0 | 155,952 | 154,860 | 153,776 | 152,700 | 151,631 | 150,570 | 149,516 | 148,469 | 147,430 | 146,398 | 145,373 | 144,355 | 143,345 | 142,341 | |
| (% change) | 0% | -0.7% | -0.7% | -0.7% | -0.7% | -0.7% | -0.7% | -0.7% | -0.7% | -0.7% | -0.7% | -0.7% | -0.7% | -0.7% | ||
| Av market EUR/MWh | €96 | €99 | €102 | €105 | €109 | €113 | €118 | €123 | €128 | €133 | €138 | €144 | €149 | €155 | €161 | |
| (% change) | 3% | 3% | 3.5% | 3.5% | 4% | 4% | 4% | 4% | 4% | 4% | 4% | 4% | 4% | 4% | ||
| OPEX | -€2,861,953 | -€2,947,812 | -€3,050,985 | -€3,157,770 | -€3,284,080 | -€3,415,444 | -€3,552,061 | -€3,694,144 | -€3,841,910 | -€3,995,586 | -€4,155,409 | -€4,321,626 | -€4,494,491 | -€4,674,271 | ||
| (% of sales) | 18.56% | 18.69% | 18.82% | 18.95% | 19.09% | 19.22% | 19.36% | 19.49% | 19.63% | 19.77% | 19.91% | 20.05% | 20.19% | 20.33% | ||
| EBITDA | €0 | €0 | €12,558,581 | €12,824,156 | €13,158,733 | €13,501,850 | €13,920,642 | €14,352,217 | €14,796,957 | €15,255,255 | €15,727,513 | €16,214,148 | €16,715,587 | €17,232,270 | €17,764,648 | €18,313,188 |
| (% of sales) | 81.44% | 81.31% | 81.18% | 81.05% | 80.91% | 80.78% | 80.64% | 80.51% | 80.37% | 80.23% | 80.09% | 79.95% | 79.81% | 79.67% | ||
| Financial Expenses | -€2,690,524 | -€2,690,524 | -€2,690,524 | -€2,483,560 | -€2,276,597 | -€2,069,634 | -€1,862,670 | -€1,655,707 | -€1,448,744 | -€1,241,780 | -€1,034,817 | -€827,853 | -€620,890 | -€413,927 | -€206,963 | |
| (% of sales) | 17.45% | 17.06% | 15.32% | 13.67% | 12.03% | 10.48% | 9.02% | 7.65% | 6.35% | 5.12% | 3.97% | 2.88% | 1.86% | 0.9% | ||
| PBTD | €0 | -€2,690,524 | €9,868,057 | €10,133,632 | €10,675,173 | €11,225,253 | €11,851,008 | €12,489,547 | €13,141,250 | €13,806,511 | €14,485,733 | €15,179,331 | €15,887,734 | €16,611,380 | €17,350,722 | €18,106,224 |
| Depreciation | €0 | €0 | -€2,498,131 | -€2,498,131 | -€2,279,175 | -€2,279,175 | -€2,279,175 | -€1,856,615 | -€1,856,615 | -€1,783,758 | -€1,783,758 | -€1,783,758 | -€1,783,758 | -€1,783,758 | -€1,783,758 | -€1,783,758 |
| (% of sales) | 16.2% | 15.84% | 14.06% | 13.68% | 13.25% | 10.45% | 10.12% | 9.41% | 9.12% | 8.83% | 8.55% | 8.28% | 8.01% | 7.76% | ||
| Net profit before tax | €0 | -€2,690,524 | €7,369,925 | €7,635,501 | €8,395,998 | €8,946,078 | €9,571,833 | €10,632,932 | €11,284,635 | €12,022,753 | €12,701,975 | €13,395,574 | €14,103,976 | €14,827,622 | €15,566,964 | €16,322,467 |
| Tax | €0 | €0 | -€736,993 | -€763,550 | -€839,600 | -€894,608 | -€957,183 | -€1,063,293 | -€1,128,464 | -€1,202,275 | -€1,270,198 | -€1,339,557 | -€1,410,398 | -€1,482,762 | -€1,556,696 | -€1,632,247 |
| Net profit (loss) | €0 | -€2,690,524 | €6,632,933 | €6,871,951 | €7,556,398 | €8,051,470 | €8,614,650 | €9,569,639 | €10,156,172 | €10,820,478 | €11,431,778 | €12,056,016 | €12,693,578 | €13,344,860 | €14,010,268 | €14,690,220 |
Projected Cashflow
| Year | 2024 | 2025 | 2026 | 2027 | 2028 | 2029 | 2030 | 2031 | 2032 | 2033 | 2034 | 2035 | 2036 | 2037 | 2038 | 2039 |
|---|---|---|---|---|---|---|---|---|---|---|---|---|---|---|---|---|
| Stage | Base Year | Y0 | Y1 | Y2 | Y3 | Y4 | Y5 | Y6 | Y7 | Y8 | Y9 | Y10 | Y11 | Y12 | Y13 | Y14 |
| Net profit before tax | €0 | -€2,690,524 | €7,369,925 | €7,635,501 | €8,395,998 | €8,946,078 | €9,571,833 | €10,632,932 | €11,284,635 | €12,022,753 | €12,701,975 | €13,395,574 | €14,103,976 | €14,827,622 | €15,566,964 | €16,322,467 |
| Non cash items | €0 | €0 | €2,498,131 | €2,498,131 | €2,279,175 | €2,279,175 | €2,279,175 | €1,856,615 | €1,856,615 | €1,783,758 | €1,783,758 | €1,783,758 | €1,783,758 | €1,783,758 | €1,783,758 | €1,783,758 |
| Depreciation | €0 | €0 | €2,498,131 | €2,498,131 | €2,279,175 | €2,279,175 | €2,279,175 | €1,856,615 | €1,856,615 | €1,783,758 | €1,783,758 | €1,783,758 | €1,783,758 | €1,783,758 | €1,783,758 | €1,783,758 |
| -/+ Δ in net working capital | €0 | €0 | €0 | €0 | €0 | €0 | €0 | €0 | €0 | €0 | €0 | €0 | €0 | €0 | €0 | €0 |
| Δ in inventory | €0 | €0 | €0 | €0 | €0 | €0 | €0 | €0 | €0 | €0 | €0 | €0 | €0 | €0 | €0 | €0 |
| Δ in receivables | €0 | €0 | €0 | €0 | €0 | €0 | €0 | €0 | €0 | €0 | €0 | €0 | €0 | €0 | €0 | €0 |
| Δ in payables | €0 | €0 | €0 | €0 | €0 | €0 | €0 | €0 | €0 | €0 | €0 | €0 | €0 | €0 | €0 | €0 |
| Financial expenses | €0 | €2,690,524 | €2,690,524 | €2,690,524 | €2,483,560 | €2,276,597 | €2,069,634 | €1,862,670 | €1,655,707 | €1,448,744 | €1,241,780 | €1,034,817 | €827,853 | €620,890 | €413,927 | €206,963 |
| Operating Cashflow | €0 | -€2,690,524 | €12,558,581 | €12,824,156 | €13,158,733 | €13,501,850 | €13,920,642 | €14,352,217 | €14,796,957 | €15,255,255 | €15,727,513 | €16,214,148 | €16,715,587 | €17,232,270 | €17,764,648 | €18,313,188 |
| Capital expenditures | €0 | €0 | €0 | €0 | €0 | €0 | -€170,000 | €0 | €0 | €0 | €0 | €0 | -€850,000 | €0 | €0 | €0 |
| Paid tax | €0 | €0 | -€736,993 | -€763,550 | -€839,600 | -€894,608 | -€957,183 | -€1,063,293 | -€1,128,464 | -€1,202,275 | -€1,270,198 | -€1,339,557 | -€1,410,398 | -€1,482,762 | -€1,556,696 | -€1,632,247 |
| Free Cashflow | €0 | €0 | €11,821,588 | €12,060,606 | €12,319,134 | €12,607,242 | €12,793,458 | €13,288,924 | €13,668,494 | €14,052,979 | €14,457,316 | €14,874,591 | €14,455,190 | €15,749,508 | €16,207,952 | €16,680,941 |
| New bank loans | €0 | €49,276,992 | €0 | €0 | €0 | €0 | €0 | €0 | €0 | €0 | €0 | €0 | €0 | €0 | €0 | €0 |
| Capital contributions | €16,000,000 | €425,664 | €0 | €0 | €0 | €0 | €0 | €0 | €0 | €0 | €0 | €0 | €0 | €0 | €0 | €0 |
| New intra-group loans | €0 | €0 | €0 | €0 | €0 | €0 | €0 | €0 | €0 | €0 | €0 | €0 | €0 | €0 | €0 | €0 |
| Sale of assets | €0 | €0 | €0 | €0 | €0 | €0 | €0 | €0 | €0 | €0 | €0 | €0 | €0 | €0 | €0 | €0 |
| Inflow Total | €16,000,000 | €49,702,656 | €0 | €0 | €0 | €0 | €0 | €0 | €0 | €0 | €0 | €0 | €0 | €0 | €0 | €0 |
| Repayment of bank loan | €0 | €0 | €0 | -€3,790,538 | -€3,790,538 | -€3,790,538 | -€3,790,538 | -€3,790,538 | -€3,790,538 | -€3,790,538 | -€3,790,538 | -€3,790,538 | -€3,790,538 | -€3,790,538 | -€3,790,538 | -€3,790,538 |
| Repayment of intra-group loans | €0 | €0 | €0 | €0 | €0 | €0 | €0 | €0 | €0 | €0 | €0 | €0 | €0 | €0 | €0 | €0 |
| Interest Paid | €0 | -€2,690,524 | -€2,690,524 | -€2,690,524 | -€2,483,560 | -€2,276,597 | -€2,069,634 | -€1,862,670 | -€1,655,707 | -€1,448,744 | -€1,241,780 | -€1,034,817 | -€827,853 | -€620,890 | -€413,927 | -€206,963 |
| Installments | €0 | €2,690,524 | €2,690,524 | €6,481,062 | €6,274,098 | €6,067,135 | €5,860,172 | €5,653,208 | €5,446,245 | €5,239,281 | €5,032,318 | €4,825,355 | €4,618,391 | €4,411,428 | €4,204,465 | €3,997,501 |
| Divident Paid | €0 | €0 | €0 | €0 | €0 | €0 | €0 | €0 | €0 | €0 | €0 | €0 | €0 | €0 | €0 | €0 |
| Acqusition of Assets | -€16,000,000 | -€49,702,656 | €0 | €0 | €0 | €0 | €0 | €0 | €0 | €0 | €0 | €0 | €0 | €0 | €0 | €0 |
| Outflow Total | -€16,000,000 | -€52,393,180 | -€2,690,524 | -€6,481,062 | -€6,274,098 | -€6,067,135 | -€5,860,172 | -€5,653,208 | -€5,446,245 | -€5,239,281 | -€5,032,318 | -€4,825,355 | -€4,618,391 | -€4,411,428 | -€4,204,465 | -€3,997,501 |
| Surplus/Deficit | €0 | -€2,690,524 | €6,440,540 | €5,579,544 | €6,045,035 | €6,540,107 | €6,933,287 | €7,635,716 | €8,222,249 | €8,813,698 | €9,424,998 | €10,049,236 | €9,836,798 | €11,338,080 | €12,003,487 | €12,683,440 |
| Cash beginning of the period | €0 | €49,702,656 | -€2,690,524 | €3,750,017 | €9,329,561 | €15,374,596 | €21,914,703 | €28,847,990 | €36,483,706 | €44,705,955 | €53,519,653 | €62,944,650 | €72,993,886 | €82,830,685 | €94,168,764 | €106,172,252 |
| Cash end of the period | €0 | -€52,393,180 | €3,750,017 | €9,329,561 | €15,374,596 | €21,914,703 | €28,847,990 | €36,483,706 | €44,705,955 | €53,519,653 | €62,944,650 | €72,993,886 | €82,830,685 | €94,168,764 | €106,172,252 | €118,855,692 |
| Cash blocked into DSRA | €1,000,000 | €1,500,000 | €2,000,000 | €2,500,000 | €3,000,000 | €3,500,000 | €4,000,000 | €4,500,000 | €4,500,000 | €4,500,000 | €4,500,000 | €4,500,000 | €4,500,000 | €4,500,000 | ||
Financial Performance
Depreciation
| Assets /Net balance value/ | Depreciation schedule | ||||||||||||
|---|---|---|---|---|---|---|---|---|---|---|---|---|---|
| Base Year | Construction | Start Up | Full Operation | ||||||||||
| 2024 | 2025 | 2026 | 2027 | 2028 | 2029 | 2030 | 2031 | 2032 | 2033 | 2034 | 2035 | 2050 | |
| Y0 | Y1 | Y2 | Y3 | Y4 | Y5 | Y6 | Y7 | Y8 | Y9 | Y10 | Y25 | ||
| Non-current assets | |||||||||||||
| Land with project rights | €16,000,000 | €16,000,000 | €16,000,000 | €16,000,000 | €16,000,000 | €16,000,000 | €16,000,000 | €16,000,000 | €16,000,000 | €16,000,000 | €16,000,000 | €16,000,000 | €16,000,000 |
| Buldings, fences, roads, etc. | €2,627,481 | €2,522,382 | €2,417,283 | €2,312,183 | €2,207,084 | €2,101,985 | €1,996,886 | €1,891,786 | €1,786,687 | €1,681,588 | €1,576,489 | €0 | |
| Equipment & Construction | €44,517,175 | €42,197,000 | €39,876,825 | €37,775,607 | €35,674,388 | €33,573,170 | €31,894,511 | €30,215,853 | €28,537,194 | €26,858,536 | €25,179,877 | -€0 | |
| Photovoltaic panels & constructions, incl. fixing | €41,966,462 | €40,287,804 | €38,609,145 | €36,930,487 | €35,251,828 | €33,573,170 | €31,894,511 | €30,215,853 | €28,537,194 | €26,858,536 | €25,179,877 | -€0 | |
| Invertors incl. electricity network instalation | €2,112,800 | €1,690,240 | €1,267,680 | €845,120 | €422,560 | €0 | €0 | €0 | €0 | €0 | €0 | €0 | |
| Management, video & security systems hardware & software | €437,913 | €218,957 | €0 | €0 | €0 | €0 | €0 | €0 | €0 | €0 | €0 | €0 | |
| Other | €510,000 | €437,143 | €364,286 | €291,429 | €218,571 | €145,714 | €72,857 | €0 | €0 | €0 | €0 | €0 | |
| Total non-current assets | €16,000,000 | €63,654,656 | €61,156,525 | €58,658,393 | €56,379,218 | €54,100,044 | €51,820,869 | €49,964,254 | €48,107,639 | €46,323,881 | €44,540,124 | €42,756,366 | €16,000,000 |
| Total Depreciation | €2,498,131 | €2,498,131 | €2,279,175 | €2,279,175 | €2,279,175 | €1,856,615 | €1,856,615 | €1,783,758 | €1,783,758 | €1,783,758 | €1,783,758 | ||
| REVENUE | €15,420,534 | €15,771,968 | €16,209,719 | €16,659,619 | €17,204,722 | €17,767,661 | €18,349,019 | €18,949,398 | €19,569,423 | €20,209,734 | €32,756,645 | ||
| As % of Revenue | 16% | 16% | 14% | 14% | 13% | 10% | 10% | 9% | 9% | 9% | 5% | ||
| Depreciation rate | 4% | 4% | 4% | 4% | 4% | 4% | 4% | 4% | 4% | 4% | 4% | ||
|---|---|---|---|---|---|---|---|---|---|---|---|---|---|
| Years | Y0 | Y1 | Y2 | Y3 | Y4 | Y5 | Y6 | Y7 | Y8 | Y9 | Y10 | Y25 | |
| Buildings, fences, roads, etc. | Y0 | ||||||||||||
| Y1 | €105,099 | €105,099 | €105,099 | €105,099 | €105,099 | €105,099 | €105,099 | €105,099 | €105,099 | €105,099 | €105,099 | ||
| Y2 | €105,099 | €105,099 | €105,099 | €105,099 | €105,099 | €105,099 | €105,099 | €105,099 | €105,099 | €105,099 | |||
| Y3 | €105,099 | €105,099 | €105,099 | €105,099 | €105,099 | €105,099 | €105,099 | €105,099 | €105,099 | ||||
| Y4 | €105,099 | €105,099 | €105,099 | €105,099 | €105,099 | €105,099 | €105,099 | €105,099 | |||||
| Y5 | €105,099 | €105,099 | €105,099 | €105,099 | €105,099 | €105,099 | €105,099 | ||||||
| Y6 | €105,099 | €105,099 | €105,099 | €105,099 | €105,099 | €105,099 | |||||||
| Y7 | €105,099 | €105,099 | €105,099 | €105,099 | €105,099 | ||||||||
| Y8 | €105,099 | €105,099 | €105,099 | €105,099 | |||||||||
| Y9 | €105,099 | €105,099 | €105,099 | ||||||||||
| Y10 | €105,099 | €105,099 | |||||||||||
| Y11 | €105,099 | ||||||||||||
| Y12 | €105,099 | ||||||||||||
| Y13 | €105,099 | ||||||||||||
| Y14 | €105,099 | ||||||||||||
| Y15 | €105,099 | ||||||||||||
| Y16 | €105,099 | ||||||||||||
| Y17 | €105,099 | ||||||||||||
| Y18 | €105,099 | ||||||||||||
| Y19 | €105,099 | ||||||||||||
| Y20 | €105,099 | ||||||||||||
| Y21 | €105,099 | ||||||||||||
| Y22 | €105,099 | ||||||||||||
| Y23 | €105,099 | ||||||||||||
| Y24 | €105,099 | ||||||||||||
| Y25 | €105,099 | ||||||||||||
| Total | €0 | €105,099 | €210,198 | €315,298 | €420,397 | €525,496 | €630,595 | €735,695 | €840,794 | €945,893 | €1,050,992 | €2,627,481 | |
| Depreciation rate | 4% | 4% | 4% | 4% | 4% | 4% | 4% | 4% | 4% | 4% | 4% | ||
|---|---|---|---|---|---|---|---|---|---|---|---|---|---|
| Years | Y0 | Y1 | Y2 | Y3 | Y4 | Y5 | Y6 | Y7 | Y8 | Y9 | Y10 | Y25 | |
| Photovoltaic panels, BESS & constructions incl. fixing | Y0 | ||||||||||||
| Y1 | €1,678,658 | €1,678,658 | €1,678,658 | €1,678,658 | €1,678,658 | €1,678,658 | €1,678,658 | €1,678,658 | €1,678,658 | €1,678,658 | €1,678,658 | ||
| Y2 | €1,678,658 | €1,678,658 | €1,678,658 | €1,678,658 | €1,678,658 | €1,678,658 | €1,678,658 | €1,678,658 | €1,678,658 | €1,678,658 | |||
| Y3 | €1,678,658 | €1,678,658 | €1,678,658 | €1,678,658 | €1,678,658 | €1,678,658 | €1,678,658 | €1,678,658 | €1,678,658 | ||||
| Y4 | €1,678,658 | €1,678,658 | €1,678,658 | €1,678,658 | €1,678,658 | €1,678,658 | €1,678,658 | €1,678,658 | |||||
| Y5 | €1,678,658 | €1,678,658 | €1,678,658 | €1,678,658 | €1,678,658 | €1,678,658 | €1,678,658 | ||||||
| Y6 | €1,678,658 | €1,678,658 | €1,678,658 | €1,678,658 | €1,678,658 | €1,678,658 | |||||||
| Y7 | €1,678,658 | €1,678,658 | €1,678,658 | €1,678,658 | €1,678,658 | ||||||||
| Y8 | €1,678,658 | €1,678,658 | €1,678,658 | €1,678,658 | |||||||||
| Y9 | €1,678,658 | €1,678,658 | €1,678,658 | ||||||||||
| Y10 | €1,678,658 | €1,678,658 | |||||||||||
| Y11 | €1,678,658 | ||||||||||||
| Y12 | €1,678,658 | ||||||||||||
| Y13 | €1,678,658 | ||||||||||||
| Y14 | €1,678,658 | ||||||||||||
| Y15 | €1,678,658 | ||||||||||||
| Y16 | €1,678,658 | ||||||||||||
| Y17 | €1,678,658 | ||||||||||||
| Y18 | €1,678,658 | ||||||||||||
| Y19 | €1,678,658 | ||||||||||||
| Y20 | €1,678,658 | ||||||||||||
| Y21 | €1,678,658 | ||||||||||||
| Y22 | €1,678,658 | ||||||||||||
| Y23 | €1,678,658 | ||||||||||||
| Y24 | €1,678,658 | ||||||||||||
| Y25 | €1,678,658 | ||||||||||||
| Total | €0 | €1,678,658 | €3,357,317 | €5,035,975 | €6,714,634 | €8,393,292 | €10,071,951 | €11,750,609 | €13,429,268 | €15,107,926 | €16,786,585 | €41,966,462 | |
| Depreciation rate | 20% | 20% | 20% | 20% | 20% | 0% | 0% | 0% | 0% | 0% | ||
|---|---|---|---|---|---|---|---|---|---|---|---|---|
| Years | Y0 | Y1 | Y2 | Y3 | Y4 | Y5 | Y6 | Y7 | Y8 | Y9 | Y10 | |
| Invertors incl. electricity network instalation | Y0 | |||||||||||
| Y1 | €422,560 | €422,560 | €422,560 | €422,560 | €422,560 | |||||||
| Y2 | €422,560 | €422,560 | €422,560 | €422,560 | ||||||||
| Y3 | €422,560 | €422,560 | €422,560 | |||||||||
| Y4 | €422,560 | €422,560 | ||||||||||
| Y5 | €422,560 | |||||||||||
| Total | €0 | €422,560 | €845,120 | €1,267,680 | €1,690,240 | €2,112,800 | ||||||
| Depreciation rate | 50% | 50% | 0% | 0% | 0% | 0% | 0% | 0% | 0% | 0% | ||
|---|---|---|---|---|---|---|---|---|---|---|---|---|
| Years | Y0 | Y1 | Y2 | Y3 | Y4 | Y5 | Y6 | Y7 | Y8 | Y9 | Y10 | |
| Management, video & security systems hardware & software | Y0 | |||||||||||
| Y1 | €218,957 | €218,957 | ||||||||||
| Y2 | €218,957 | |||||||||||
| Y3 | ||||||||||||
| Y4 | ||||||||||||
| Y5 | ||||||||||||
| Total | €0 | €218,957 | €437,913 | |||||||||
| Depreciation rate | 14% | 14% | 14% | 14% | 14% | 14% | 14% | 0% | 0% | 0% | ||
|---|---|---|---|---|---|---|---|---|---|---|---|---|
| Years | Y0 | Y1 | Y2 | Y3 | Y4 | Y5 | Y6 | Y7 | Y8 | Y9 | Y10 | |
| Other | Y0 | |||||||||||
| Y1 | €72,857 | €72,857 | €72,857 | €72,857 | €72,857 | €72,857 | €72,857 | |||||
| Y2 | €72,857 | €72,857 | €72,857 | €72,857 | €72,857 | €72,857 | ||||||
| Y3 | €72,857 | €72,857 | €72,857 | €72,857 | €72,857 | |||||||
| Y4 | €72,857 | €72,857 | €72,857 | €72,857 | ||||||||
| Y5 | €72,857 | €72,857 | €72,857 | |||||||||
| Y6 | €72,857 | €72,857 | ||||||||||
| Y7 | €72,857 | |||||||||||
| Total | €0 | €72,857 | €145,714 | €218,571 | €291,429 | €364,286 | €437,143 | €510,000 | ||||
Financing
| As % | Price | weighted avg price | Amount | ||
|---|---|---|---|---|---|
| Total investment | € 65,702,656 | ||||
| Equity | 25% | 11.62% | 2.90% | € 16,425,664 | |
| Debt | 75% | 5.46% | 4.10% | € 49,276,992 | |
| WACC | 6.59% | ||||
| ße=(ßa(Ve+Vd(1-T)))/Ve | |||||
| ß(e) equity project (geared) | |||||
| ß(a) asset/sector (ungeared) | |||||
| Tax rate | |||||
| V(e) (value/proportion of equity in project) | |||||
| V(d) (value/proportion of debt in project) | |||||
| ßa production of electricity from RES (ungeared) | 0.58 | ||||
| Tax rate | 0.1 | ||||
| Ve | 0.25 | ||||
| Vd | 0.75 | ||||
| ße | 2.146 | ||||
| Rf State Bonds Y10 (BNB) | 2.97% | ||||
| R market | 7% | ||||
| Price E (Cost of capital) = Rf+ße(Rm-Rf) | |||||
| Price E | 11.62% | ||||
Debt Repayment
| Volume | € 49,276,992 |
| Interest Rate | 5.21% |
| Spread | 1.50% |
| EURIBOR | 3.71% |
| Fees p.a. | 0.25% |
| Term | 15 years |
| Installments p.a. | 12 |
| Grace Period | 2 Years |
| Equalizing installment | 0.00% |
| Total payment last year | 0.00% |
| Repayment Term | 13 Years |
| Bank Loan Repayment Schedule | |||||||||||||||
|---|---|---|---|---|---|---|---|---|---|---|---|---|---|---|---|
| Base Year | Construction | Start Up | Full Operation | ||||||||||||
| 2024 | 2025 | 2026 | 2027 | 2028 | 2029 | 2030 | 2031 | 2032 | 2033 | 2034 | 2035 | 2036 | 2037 | 2038 | |
| Y0 | Y1 | Y2 | Y3 | Y4 | Y5 | Y6 | Y7 | Y8 | Y9 | Y10 | Y11 | Y12 | Y13 | Y14 | |
| Principal Opening Balance | € 49,276,992 | € 49,276,992 | € 49,276,992 | € 45,486,454 | € 41,695,916 | € 37,905,378 | € 34,114,841 | € 30,324,303 | € 26,533,765 | € 22,743,227 | € 18,952,689 | € 15,162,151 | € 11,371,614 | € 7,581,076 | € 3,790,538 |
| Repayments | € 0 | € 0 | -€ 3,790,538 | -€ 3,790,538 | -€ 3,790,538 | -€ 3,790,538 | -€ 3,790,538 | -€ 3,790,538 | -€ 3,790,538 | -€ 3,790,538 | -€ 3,790,538 | -€ 3,790,538 | -€ 3,790,538 | -€ 3,790,538 | -€ 3,790,538 |
| Principal Closing Balance | € 49,276,992 | € 49,276,992 | € 45,486,454 | € 41,695,916 | € 37,905,378 | € 34,114,841 | € 30,324,303 | € 26,533,765 | € 22,743,227 | € 18,952,689 | € 15,162,151 | € 11,371,614 | € 7,581,076 | € 3,790,538 | € 0 |
| Interest & Fees Payments | -€ 2,690,524 | -€ 2,690,524 | -€ 2,690,524 | -€ 2,483,560 | -€ 2,276,597 | -€ 2,069,634 | -€ 1,862,670 | -€ 1,655,707 | -€ 1,448,744 | -€ 1,241,780 | -€ 1,034,817 | -€ 827,853 | -€ 620,890 | -€ 413,927 | -€ 206,963 |
| Installments | -€ 2,690,524 | -€ 2,690,524 | -€ 6,481,062 | -€ 6,274,098 | -€ 6,067,135 | -€ 5,860,172 | -€ 5,653,208 | -€ 5,446,245 | -€ 5,239,281 | -€ 5,032,318 | -€ 4,825,355 | -€ 4,618,391 | -€ 4,411,428 | -€ 4,204,465 | -€ 3,997,501 |
Yield
| 2024 | 2025 | 2026 | 2027 | 2028 | 2029 | 2030 | 2031 | 2032 | 2033 | 2034 | 2035 | 2036 | 2037 | 2038 | 2039 | 2050 | |
|---|---|---|---|---|---|---|---|---|---|---|---|---|---|---|---|---|---|
| Return on Investment | Base | Construction | Start Up | Full Operation | |||||||||||||
| Y0 | Y1 | Y2 | Y3 | Y4 | Y5 | Y6 | Y7 | Y8 | Y9 | Y10 | Y11 | Y12 | Y13 | Y14 | Y25 | ||
| Investment | € 65,702,656 | ||||||||||||||||
| Net Profit | € 0 | -€ 2,690,524 | € 6,632,933 | € 6,871,951 | € 7,556,398 | € 8,051,470 | € 8,614,650 | € 9,569,639 | € 10,156,172 | € 10,820,478 | € 11,431,778 | € 12,056,016 | € 12,693,578 | € 13,344,860 | € 14,010,268 | € 14,690,220 | € 21,399,357 |
| Cashflow to Finance | € 65,702,656 | -€ 2,690,524 | € 12,558,581 | € 12,824,156 | € 13,158,733 | € 13,501,850 | € 13,920,642 | € 14,352,217 | € 14,796,957 | € 15,255,255 | € 15,727,513 | € 16,214,148 | € 16,715,587 | € 17,232,270 | € 17,764,648 | € 18,313,188 | € 25,560,821 |
| Residual Value | € 32,000,000 | ||||||||||||||||
| Cashflow to Finance Total | -€ 65,702,656 | -€ 2,690,524 | € 12,558,581 | € 12,824,156 | € 13,158,733 | € 13,501,850 | € 13,920,642 | € 14,352,217 | € 14,796,957 | € 15,255,255 | € 15,727,513 | € 16,214,148 | € 16,715,587 | € 17,232,270 | € 17,764,648 | € 18,313,188 | € 57,560,821 |
| Discounting factor applied | 1.0000 | 0.9382 | 0.8802 | 0.8258 | 0.7747 | 0.7268 | 0.6819 | 0.6397 | 0.6002 | 0.5631 | 0.5282 | 0.4956 | 0.4649 | 0.4362 | 0.4092 | 0.4092 | |
| Discounted | -€ 65,702,656 | -€ 2,690,524 | € 11,782,127 | € 11,287,431 | € 10,865,846 | € 10,459,860 | € 10,117,542 | € 9,786,286 | € 9,465,738 | € 9,155,555 | € 8,855,405 | € 8,564,966 | € 8,283,928 | € 8,011,988 | € 7,748,856 | € 7,494,248 | € 23,555,433 |
| Cumulative | -€ 68,393,180 | -€ 56,611,053 | -€ 45,323,622 | -€ 34,457,776 | -€ 23,997,916 | -€ 13,880,374 | -€ 4,094,088 | € 5,371,649 | € 14,527,204 | € 23,382,609 | € 31,947,575 | € 40,231,503 | € 48,243,491 | € 55,992,346 | € 63,486,594 | € 175,933,155 | |
| Return on Investment | ||
|---|---|---|
| Discounting Factor | DF | 0.0659 |
| Net Present Value | NPV | € 175,933,155 |
| Internal Rate of Return | IRR | 18.07% |
| Return on Capital Employed | ROCE | 7.09% |
| Payback Period | Payback | 7.43 |
| 2024 | 2025 | 2026 | 2027 | 2028 | 2029 | 2030 | 2031 | 2032 | 2033 | 2034 | 2035 | 2036 | 2037 | 2038 | 2039 | 2050 | |
|---|---|---|---|---|---|---|---|---|---|---|---|---|---|---|---|---|---|
| Return on Equity | Base | Construction | Start Up | Full Operation | |||||||||||||
| Y0 | Y1 | Y2 | Y3 | Y4 | Y5 | Y6 | Y7 | Y8 | Y9 | Y10 | Y11 | Y12 | Y13 | Y14 | Y25 | ||
| Equity | € 16,425,664 | ||||||||||||||||
| Cashflow to Finance | € 0 | -€ 2,690,524 | € 12,558,581 | € 12,824,156 | € 13,158,733 | € 13,501,850 | € 13,920,642 | € 14,352,217 | € 14,796,957 | € 15,255,255 | € 15,727,513 | € 16,214,148 | € 16,715,587 | € 17,232,270 | € 17,764,648 | € 18,313,188 | € 25,560,821 |
| Cashflow to Equity | € 16,425,664 | -€ 2,690,524 | € 9,131,064 | € 5,579,544 | € 6,045,035 | € 6,540,107 | € 6,933,287 | € 7,635,716 | € 8,222,249 | € 8,813,698 | € 9,424,998 | € 10,049,236 | € 9,836,798 | € 11,338,080 | € 12,003,487 | € 12,683,440 | € 23,183,114 |
| Residual Value | € 32,000,000 | ||||||||||||||||
| Cashflow to Equity Total | -€ 16,425,664 | -€ 2,690,524 | € 9,131,064 | € 5,579,544 | € 6,045,035 | € 6,540,107 | € 6,933,287 | € 7,635,716 | € 8,222,249 | € 8,813,698 | € 9,424,998 | € 10,049,236 | € 9,836,798 | € 11,338,080 | € 12,003,487 | € 12,683,440 | € 55,183,114 |
| Discounting factor applied | 1.0000 | 0.8959 | 0.8027 | 0.7191 | 0.6443 | 0.5772 | 0.5171 | 0.4633 | 0.4151 | 0.3719 | 0.3332 | 0.2985 | 0.2674 | 0.2396 | 0.2146 | 0.2146 | |
| Discounted | -€ 16,425,664 | -€ 2,690,524 | € 8,180,610 | € 4,478,446 | € 4,347,021 | € 4,213,490 | € 4,001,848 | € 3,948,530 | € 3,809,260 | € 3,658,242 | € 3,504,772 | € 3,347,926 | € 2,936,033 | € 3,031,872 | € 2,875,697 | € 2,722,307 | € 11,844,213 |
| Cumulative | -€ 19,116,188 | -€ 10,935,578 | -€ 6,457,132 | -€ 2,110,112 | € 2,103,379 | € 6,105,227 | € 10,053,757 | € 13,863,017 | € 17,521,259 | € 21,026,031 | € 24,373,958 | € 27,309,990 | € 30,341,863 | € 33,217,560 | € 35,939,867 | € 90,127,064 | |
| Return on Equity | ||
|---|---|---|
| Discounting Factor | DF | 0.1162 |
| Net Present Value | NPV | € 90,127,064 |
| Internal Rate of Return | IRR | 31.83% |
| Return on Capital Employed | ROCE | 11.07% |
| Payback Period | Payback | 4.5 |
Ratios
| Construction | Start Up | Full Operation | |||||||||||||
|---|---|---|---|---|---|---|---|---|---|---|---|---|---|---|---|
| Y0 | Y1 | Y2 | Y3 | Y4 | Y5 | Y6 | Y7 | Y8 | Y9 | Y10 | Y11 | Y12 | Y13 | Y14 | |
| Return | |||||||||||||||
| ROE (%) | -19.59% | 34.92% | 26.57% | 22.61% | 19.41% | 17.20% | 16.04% | 14.55% | 13.42% | 12.42% | 11.58% | 10.87% | 10.25% | 9.72% | 9.25% |
| RoCapital (%) | -4.27% | 10.47% | 9.79% | 9.72% | 9.38% | 9.12% | 9.20% | 8.90% | 8.66% | 8.38% | 8.12% | 7.88% | 7.65% | 7.43% | 7.23% |
| Profitability | |||||||||||||||
| EBITDA MARGIN (%) | 81.44% | 81.31% | 81.18% | 81.05% | 80.91% | 80.78% | 80.64% | 80.51% | 80.37% | 80.23% | 80.09% | 79.95% | 79.81% | 79.67% | |
| NET PROFIT MARGIN (%) | 43.01% | 43.57% | 46.62% | 48.33% | 50.07% | 53.86% | 55.35% | 57.10% | 58.42% | 59.65% | 60.82% | 61.91% | 62.94% | 63.91% | |
| Coverage | |||||||||||||||
| INTEREST & FEES | 2.67 | 2.82 | 2.96 | 3.13 | 3.29 | 3.47 | 3.64 | 3.82 | 4.00 | 4.19 | 4.38 | 4.58 | 4.78 | ||
| INTEREST & FEES & Principal | 3.67 | 1.56 | 1.70 | 1.85 | 2.02 | 2.21 | 2.41 | 2.64 | 2.88 | 3.15 | 3.44 | 3.77 | 4.13 | 4.53 | |
| BANK DEBT COVERAGE (YEARS) | |||||||||||||||
| MARGIN OF SAFETY | |||||||||||||||
| DEBT/REVENUE | 3.20 | 3.12 | 3.04 | 2.96 | 2.86 | 2.77 | 2.69 | 2.60 | 2.52 | 2.44 | 2.36 | 2.29 | 2.21 | 2.14 | |
| Gearing | |||||||||||||||
| DEBT TO EQUITY | 3.00 | 2.77 | 2.54 | 2.31 | 2.08 | 1.85 | 1.62 | 1.38 | 1.15 | 0.92 | 0.69 | 0.46 | 0.23 | 0.00 | |
| DEBT TO CAPITAL | 0.75 | 0.69 | 0.63 | 0.58 | 0.52 | 0.46 | 0.40 | 0.35 | 0.29 | 0.23 | 0.17 | 0.12 | 0.06 | 0.00 | |
| Growth | |||||||||||||||
| Revenue Growth | 2.28% | 2.78% | 2.78% | 3.27% | 3.27% | 3.27% | 3.27% | 3.27% | 3.27% | 3.27% | 3.27% | 3.27% | 3.27% | ||
| EBITDA Growth | 2.11% | 2.61% | 2.61% | 3.10% | 3.10% | 3.10% | 3.10% | 3.10% | 3.09% | 3.09% | 3.09% | 3.09% | 3.09% | ||
| Net Earnings Growth | -373.92% | 3.60% | 9.96% | 6.55% | 6.99% | 11.09% | 6.13% | 6.54% | 5.65% | 5.46% | 5.29% | 5.13% | 4.99% | 4.85% | |
| Cash surplus/deficit | € 6,440,540 | € 5,579,544 | € 6,045,035 | € 6,540,107 | € 6,933,287 | € 7,635,716 | € 8,222,249 | € 8,813,698 | € 9,424,998 | € 10,049,236 | € 9,836,798 | € 11,338,080 | € 12,003,487 | € 12,683,440 | |
| Possible Cash Sweep p.a. | |||||||||||||||
| Principal Opening Balance | € 49,276,992 | € 49,276,992 | € 49,276,992 | € 45,486,454 | € 41,695,916 | € 37,905,378 | € 34,114,841 | € 30,324,303 | € 26,533,765 | € 22,743,227 | € 18,952,689 | € 15,162,151 | € 11,371,614 | € 7,581,076 | € 3,790,538 |
| Repayments | € 0 | € 0 | -€ 3,790,538 | -€ 3,790,538 | -€ 3,790,538 | -€ 3,790,538 | -€ 3,790,538 | -€ 3,790,538 | -€ 3,790,538 | -€ 3,790,538 | -€ 3,790,538 | -€ 3,790,538 | -€ 3,790,538 | -€ 3,790,538 | -€ 3,790,538 |
| 70% | -€ 4,508,378 | -€ 3,905,681 | -€ 4,231,525 | -€ 4,578,075 | -€ 4,853,301 | -€ 5,345,001 | -€ 5,755,574 | -€ 6,169,588 | -€ 6,597,498 | -€ 7,034,465 | -€ 6,885,759 | -€ 7,936,656 | -€ 8,402,441 | -€ 8,878,408 | |
| Principal closing after cash sweep | € 49,276,992 | € 44,768,614 | € 41,580,773 | € 37,464,392 | € 33,327,303 | € 29,261,540 | € 24,979,302 | € 20,778,191 | € 16,573,639 | € 12,355,191 | € 8,127,686 | € 4,485,855 | -€ 355,580 | -€ 4,611,903 | -€ 8,878,408 |
| Principal Opening Balance | € 49,276,992 | € 49,276,992 | € 49,276,992 | € 45,486,454 | € 41,695,916 | € 37,905,378 | € 34,114,841 | € 30,324,303 | € 26,533,765 | € 22,743,227 | € 18,952,689 | € 15,162,151 | € 11,371,614 | € 7,581,076 | € 3,790,538 |
| Repayments | € 0 | € 0 | -€ 3,790,538 | -€ 3,790,538 | -€ 3,790,538 | -€ 3,790,538 | -€ 3,790,538 | -€ 3,790,538 | -€ 3,790,538 | -€ 3,790,538 | -€ 3,790,538 | -€ 3,790,538 | -€ 3,790,538 | -€ 3,790,538 | -€ 3,790,538 |
| 50% | -€ 3,220,270 | -€ 2,789,772 | -€ 3,022,518 | -€ 3,270,054 | -€ 3,466,643 | -€ 3,817,858 | -€ 4,111,124 | -€ 4,406,849 | -€ 4,712,499 | -€ 5,024,618 | -€ 4,918,399 | -€ 5,669,040 | -€ 6,001,744 | -€ 6,341,720 | |
| Principal closing after cash sweep | € 49,276,992 | € 46,056,722 | € 42,696,682 | € 38,673,399 | € 34,635,325 | € 30,648,197 | € 26,506,445 | € 22,422,641 | € 18,336,378 | € 14,240,190 | € 10,137,533 | € 6,453,214 | € 1,912,036 | -€ 2,211,206 | -€ 6,341,720 |
Acronyms
| Acronym | Definition |
|---|---|
| BESS | Battery Energy Storage System |
| CAPEX | Capital Expenditures |
| COD | Commercial Operation Date |
| DSRA | Debt Service Reserve Account |
| E_Grid | Energy Injected into the Grid |
| EBITDA | Earnings Before Interest, Tax, Depreciation and Amortization |
| EMS | Energy Management System |
| EPC | Engineering, Procurement and Construction |
| ESO | Energy System Operator |
| EWRC | Energy and Water Regulatory Commission |
| IBEX | Independent Bulgarian Energy Exchange |
| kV | Kilovolt |
| kW | Kilowatt |
| kWp | Kilowatt peak |
| MW | Megawatt |
| MWh | Megawatt hours |
| MWp | Megawatt peak |
| OPEX | Operating Expenses |
| O&M | Operations and Maintenance |
| PBTD | Profit Before Tax & Depreciation |
| PPA | Power Purchase Agreement |
| PV | Photovoltaic |
| PVPP | Photovoltaic Power Plant |
| P&L | Profit and Loss |
| ROE | Return on Equity |
| RTB | Ready to Build |
| SPV | Special Purpose Vehicle |
| TSO | Transmission System Operator |
| VDR | Virtual Data Room |